Do you or your business find it difficult to estimate how long projects may take? Do you wish you had an accurate timeline for the tasks ahead so you can plan accordingly? If traditional to-do lists and rough estimations aren’t serving you and your success, it may just be time to try the popular Gantt chart project management tool.
The first known use of Gantt charts was developed in 1896 by Karol Adamiecki, who called it a harmonogram. In the early 20th century, management consultant and mechanical engineer Henry Gantt popularised Gantt charts to record the progress of tasks or projects. It was a great way to visualise whether production schedules were falling behind, running ahead, or staying right on track for the proposed deadline.
Gantt charts were revolutionary for project management, and modern technology has only made the tool more accessible and effective than ever. In this blog, we’ll be exploring the definition of a Gantt chart, the benefits it grants project managers, and its many uses.
What is a Gantt Chart?
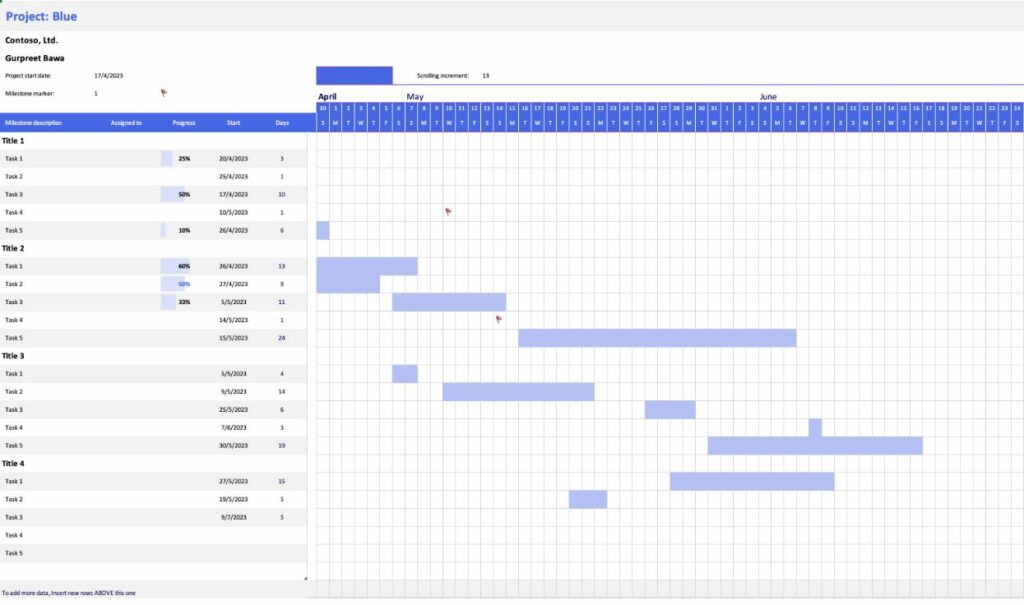
Gantt charts are horizontal bar charts that are used in project management to visualise a project’s plan and estimate progress over time. They typically show you the overall timeline, the status of each task, and who is responsible for accomplishing said tasks.
Gantt charts primarily serve as a work breakdown structure that oversees task dependencies and the necessary sequence of events for a successful final product, otherwise known as the critical path of a project.
How are Gantt Charts Used in Project Management?
Gantt charts have become a large part of modern project management, serving as a visual representation of a project’s progress. At a glance, project managers and other relevant team members can see the project’s scope, the objectives and milestones, and the deadline for expected project delivery.
They are also a great way to determine task dependencies; if a task is delayed, any other tasks dependent on that being completed will be swiftly rescheduled and resources reallocated. Gantt charts are the best point of reference for project managers and other team leaders to see the progression of their work.
Why Gantt Charts are a useful tool for project managers
- Clarity and communication. Any team members assigned to a project can see what tasks are required of them and when they need to be completed. This clarity will minimise the risk of a team member misunderstanding their role in a project, further preventing common risks like a delay in task completion or lower-quality deliverables.
- Project comprehension. Gantt charts give project managers a complete knowledge of their project’s timeline. The chart offers an overview of the project and its progress from start to finish, as well as everyone involved and the proposed deadlines. This is useful for quickly identifying any issues or giving accurate updates on task progress.
- Resource tracking. Project managers can use Gantt charts to see how resources have been allocated, from the financial budget to team member workflows, preventing high stress and burnout.
- Accountability. When project timelines are made accessible to the relevant team members, they are put in a position where they need to show accountability for their schedule and progress. This is a great way to upskill your employees’ soft skills and strengthen their communication skills and productivity.
- Productivity. With a solid project schedule in place, project managers and team members will see a dramatic increase in productivity and efficiency. Like many other time management and project management tools, Gantt charts provide teams with a great sense of direction for the tasks ahead.
Key Components of Gantt Charts in Project Management
So, how do you read and comprehend a Gantt chart? Most Gantt charts include the following components:
Task names
The task names describe the individual tasks that must be completed for the project to progress and finish by the deadline. These may be organised into groups, a task list, and/or subgroups, and the list of task names typically appears vertically on the left side of the chart.
Start and end dates
The start and end dates, shown horizontally along the top of the page, allow project managers and assignees to see the estimated duration of a project, including when work on the project is projected to begin and the date of the final deadline. Individual tasks are also placed accurately along the project timeline, each having its own clear start and end date.
Task dependencies
Task dependencies are typically visualised by lines connecting the two tasks together, showing that the jobs must happen in a certain order or succession before the project can progress. The project’s critical path can also be seen from this view. This prevents tasks from being delayed, increasing costs and affecting the project’s outcome.
Progress bars
Horizontal bars, either at the top or the bottom of the page, show the progression of the task and overall project. It may be indicated by bar shading, a percentage, or another visual cue.
Milestones
Milestones are dates, events, meetings, and other project factors that are visualised in the project timeline. These milestones serve as regular opportunities to check in on the team’s progress and whether processes are serving the project plans successfully.
For example, a necessary step or project task along the timeline may be the perfect opportunity for a milestone that ensures everyone is meeting the project requirements.
Time scale
The timeline has a horizontal time scale, commonly at the top or bottom of the page, showing the days, weeks, months, or even years that a project is planned to take place.
Legends or Keys
A legend or key is crucial to ensure clarity about the project’s timeline and the Gantt chart’s components. This will appear in different areas of the page depending on the Gantt chart software you use, and it can typically be toggled off for those with more experience who don’t need the legend to comprehend the project information.
How are Gantt Charts created?
There are multiple ways to create a Gantt chart that’s perfect for you and the project at hand. Some project teams may choose to use physical, written Gantt charts. Others will find project management software and their numerous features to better serve the project plan. Here’s a quick glance at both options.
Manually
Manually creating a Gantt chart, on paper or in an app or program, can be a time-consuming process compared to using something with a focus on project development and management.
However, it allows for a hands-on approach to the project plan and can offer complete customisation to suit your project’s needs. Among other benefits, it can also serve as a cost-effective solution for smaller projects or teams.
Project Management Software
Learning how to use digital Gantt chart tools, like apps or programs, offer significant flexibility and automation for projects of all types and sizes. These charts can be found in their own dedicated apps, or within powerful project planning programs.
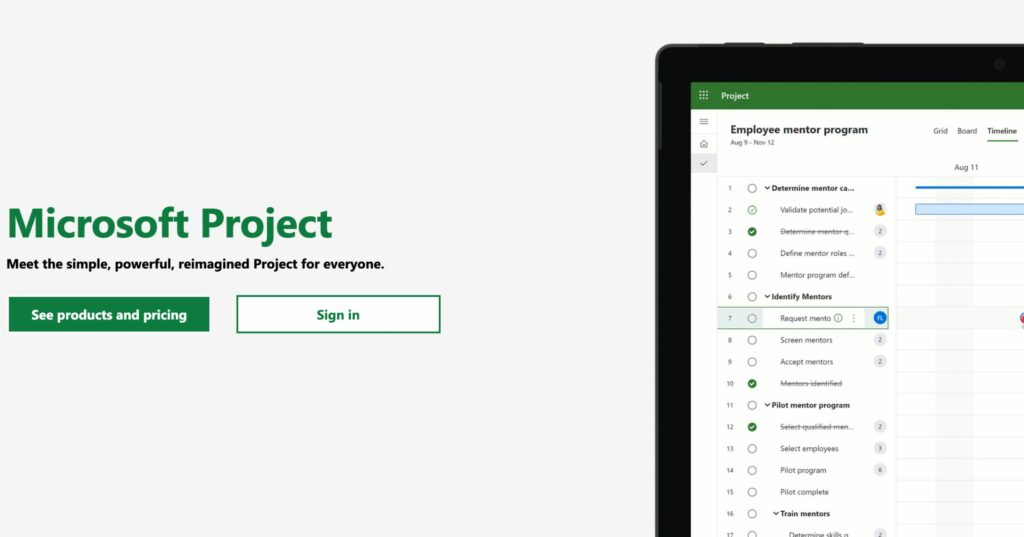
For example, Microsoft Project is a popular piece of software for users to track project progress and other relevant activity. It includes a Gantt chart interface among other templates and features, like comments for collaboration or integrations with other apps.
Popular Questions about Gantt Charts
Gantt charts are widely used project management tools that help visualise project schedules and track progress. Whether you’re a seasoned project manager or new to the world of project management, it’s natural to have questions about Gantt charts. In this section, we’ll address some of the most popular FAQs about Gantt charts, along with some tips and other details about the project planning strategy.
Why use a Gantt Chart?
Gantt charts are highly effective project management tools for team leaders. They provide a visual representation of the project, the baseline and length of the established timeline, and all of the moving parts and subtasks that make up the bigger picture. Gantt charts are incredibly useful for planning and scheduling tasks, identifying potential delays, and providing transparency for the project tasks ahead.
Are Gantt Charts used in agile project management?
Gantt charts were originally designed for traditional waterfall project management methodologies — an approach that requires a clearly defined structure with project steps and phases that do not progress until a phase receives final approval.
However, they can also be used in Agile project management, another approach that focuses on continuous progress and solutions that incorporate feedback from customers and/or stakeholders. This means the projects flow faster and require constant action and adaptability from the assignees involved.
Consequently, agile Gantt charts may focus on sprints, with the chart displaying the sprint timeline, deliverables, and milestones. The chart may also need to have room for changes and comprehensive data on activities, in order to keep things like progress and objectives clear.
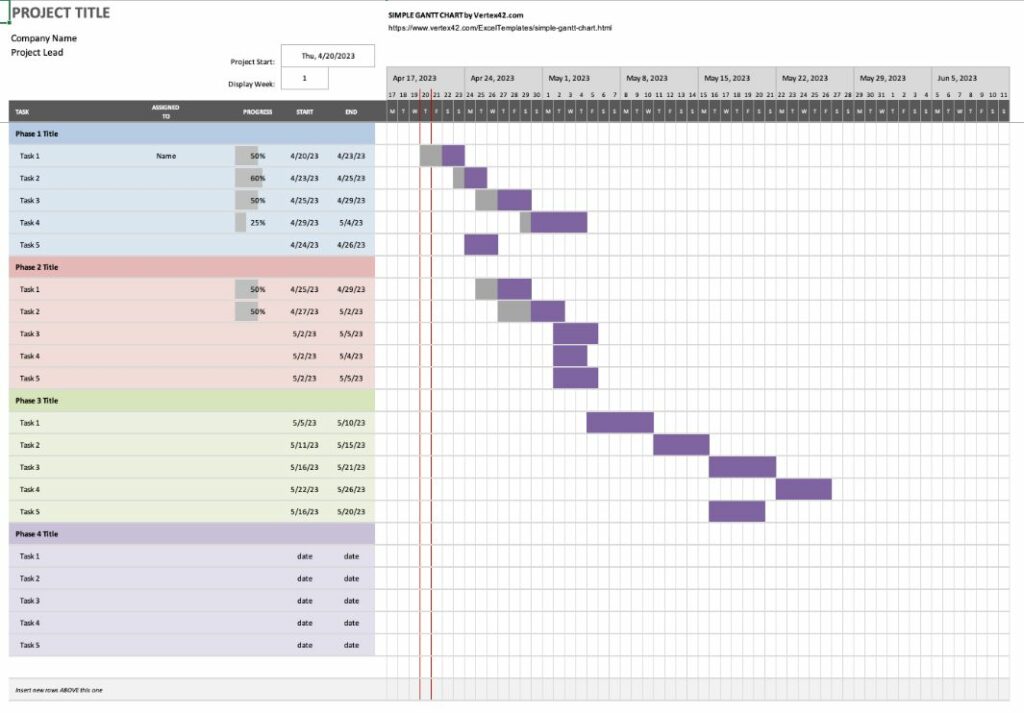
Can I make a Gantt Chart in Excel?
Yes, you can easily create a Gantt chart in Microsoft Excel. The software has built-in functionality to create the chart using the stacked bar chart feature. You’ll need to enter your project’s data (such as the start and end dates of tasks, durations, and dependencies) into an Excel spreadsheet, and then use that data to create the final Gantt chart display. You can access more information through Microsoft’s online guide.
We do, however, recommend browsing other Microsoft products like Microsoft Project for a Gantt chart tool that will better serve your business.
Does Microsoft Teams have Gantt Charts?
At this time, Microsoft Teams does not have any built-in methods for creating a Gantt chart. However, you can use third-party apps or integrations with other Microsoft products to add Gantt charts to Teams.
For example, Microsoft Project has robust Gantt chart functionality and can be integrated seamlessly with Teams. Other smaller project management softwares, such as Trello or Asana, also integrate with teams and support the creation of Gantt charts.
Can I make a Gantt Chart in Google Sheets?
Yes, you can create a Gantt chart in Google Sheets, although it may require some setup and customisation. The process involves entering your project data, adding calculated columns, creating a stacked bar chart, and adding dependencies. While it may not be as easy as using a dedicated project management software, it can be an effective option for those who prefer Google sheets or want a free solution.
What other project management software can I use to create Gantt Charts?
There are a variety of software applications available to create your own Gantt Charts. However, there will be a slight learning curve if you are not already familiar with the software.
These include:
- Microsoft Project
- Google Sheets
- Asana
- Monday
- Trello
- Airtable
- Jira
Above all else, Gantt charts are a tool used by skilled project managers to better understand their project’s timeline and serve as a great tool for determining task dependencies and progression. They provide a visual representation of the project’s tasks, goals, and deadlines, which keeps everyone involved in the project on the same page. This clarity leads to motivation, which then leads to high-quality deliverables and outcomes across the board.
If you want to learn how to use Gantt charts for project management success, there are project management courses available online to assist you as an individual or your company in mastering the tool, from the basics to the complex features.
We recommend our Project Scheduling course, provided by management experts with over 40 years of experience and relationships with a large network of successful professionals and companies.